

HbA1c Conversion Chart
The HbA1c test measures how much haemoglobin in the blood has become bonded with glucose, illustrated as yellow glucose on red blood cells in the graphic above. This gives an indication of diabetes control over the previous 2-3 months.
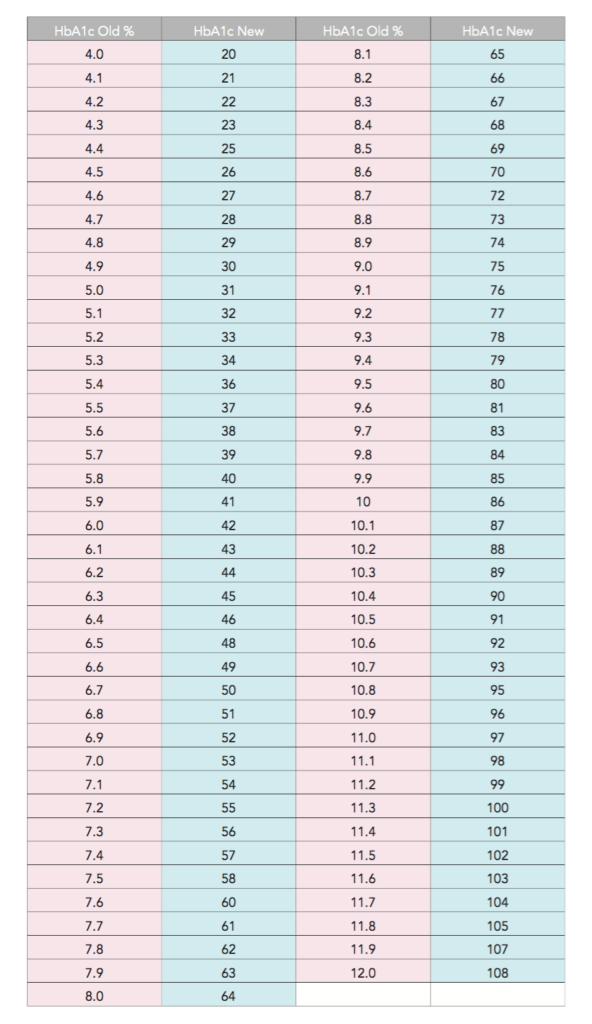
Since June 2011, the way HbA1c results are reported switched from a percentage to a measurement in mmols/mol. To make sense of the new units and compare these with old units and vice versa see the table below. Clinics and labs often give results in both measurements. Many of us still use the old % measurements.
Old unit = % HbA1c
New unit = mmol/mol
For example a target of 6.5% is now 48mmol/mol
A HbA1c should always be used as information only, it is only part of the picture, however the result will give an indication of how well your overall control is and let you see if there is room for improvement (there usually is!) Many things affect your HbA1c, and managing diabetes is looking at ways to manage those affects as quickly as possible to limit the length of time out of optimal range. Never ever beat yourself up, try and be positive and find one way to try and reduce it next time. There are always things that can be done and make a difference.
It’s interesting to note that the % HbA1c measurement does not correlate exactly to average blood glucose test results on your blood glucose meter. This table shows the differences between HbA1c and average blood glucose.

An example is if your old HbA1c was 7%, it would now be reported as 53 mmol/mol, and this would be equal to an average blood glucose of 8.6 mmol/l (the results from your blood glucose meter)


